Lately, I’ve been getting asked, “What’s going on with oil and gas?” and “What should I do with my minerals and royalties?” When I hear these questions, I have to look at it from a multi-faceted perspective that is politically driven, both nationally and globally, and with technical and fundamental research and analysis because I know what everyone really wants to know, and that is:
“How are my mineral and royalty interests going to be affected?”
These are always difficult questions to answer since everyone’s situation is different, and given everything that is currently happening in the US and globally, these questions are proving even more difficult to answer. However, I will do my best to try and shed some light on the current state of the oil and gas industry, but more specifically, the mineral and royalty acquisition markets. In this context, understanding buying mineral rights in the US is a key aspect that impacts both individual and market-level decisions.
How To Read WTI And Natural Gas Charts
To help you understand this special report, it’s important to understand the data behind the technical analysis, which helps develop my fundamental assessment. If you are new to charting, I’ve created a simple and quick guide here before getting to the good stuff.
The two charts in this article represent the price action of West Texas Intermediate Crude and Natural Gas on a weekly basis. Here’s the breakdown of the chart indicators:
Vertical Green And Red Bars = Price Action
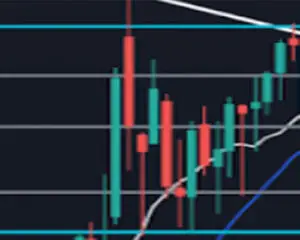 The vertical green and red bars represent the prices of oil and natural gas as they are being traded on a weekly basis. In other words, each bar, green or red, represents one week of trading. The green line represents buying activity, or prices increasing, while the red lines represent selling activity, or prices going down. This is a very high time frame and geared towards those looking for a very long-term investment strategy. For shorter time frame investment strategies, one would utilize a lower time frame such as daily, 4hr, hourly, and even down to the minute for those interested in day trading strategies.
Horizontal Gray And Blue Lines = Support And Resistance
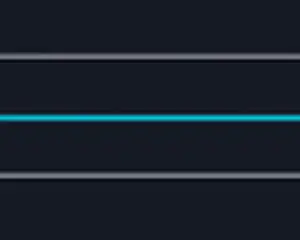 The horizontal blue and gray lines represent support and resistance. This is where the price gets “stuck” so to speak. The blue lines represent the price action farther back in history and show that some levels act as greater support or resistance depending on how many times the price has tested those price areas over a longer period of time. What this all means is that as the price is rising or falling, and as it gets closer to one of the blue lines or gray lines, the price could be supported and turn around and start going the opposite direction. Or, if support or resistance fails and the price proceeds to break through one of the blue or gray lines, the price is likely to continue on to the next blue or gray line, whether that be above or below it.
Diagonal White Lines = Support And Resistance And Price Trend
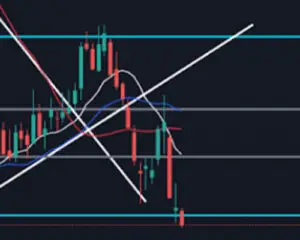 The long, diagonal white lines also represent support and resistance and the general trend of the price range. If these lines are going down and to the right, this means the general price has been trending downward. If the lines are moving up and to the right, like the bottom white line in the natural gas chart, (which is not acting as support any longer), this means the general price is trending upward. Since these lines also act as support and resistance, once prices start approaching these trend lines, price action could either be supported (meaning the price is staying consistent with the trend) or if the trend fails (meaning prices will continue to decline to the next support or rise to the next area of resistance).
Red, White And Blue Wavy Lines = Moving Average Price (Based On Timeframe) As Support And Resistance
 The red, white and blue wavy lines within each of these charts represent the average daily price over an extended period of time. The red line represents the 200-day price moving average, the blue line represents the 100-day price moving average, and the white line represents the 50-day price moving average. Meaning, on the far right, wherever the end of the line is, that represents what the average price is based on those individual time frames, from 200, 100, or 50 days ago. Because the white line is based on a much shorter time frame, it shows the most up and down change.
These lines also act as support and resistance. As the price changes on a daily basis and approaches these lines, whether the price is going up or down, the price could also be either rejected or supported in these areas. If the price moves above one or more of these lines, the price is likely to stay above them for a period of time and continue in that direction, and conversely, if the price moves below one or more of these lines, the price is likely to stay below them for an extended period of time. With that said, it should be noted that the red line, because it represents the average price over a longer period of time, will act as a stronger area of support or resistance as opposed to the blue and white lines with the white line being the weaker of the three.
The Relative Strength Index And Stochastic RSI = Overbought Or Oversold Commodity Indicators
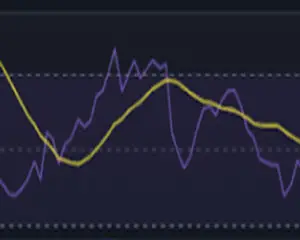 The Relative Strength Index (RSI) are the purple and yellow squiggly lines in the second graph set from the bottom. These lines also move in the direction of the general price trend. If the lines are trending up and to the right, the price is also going up, and conversely if the lines are trending down and to the left, the price is also going down. The key to using this indicator is to watch as to whether or not the purple line is above or below the yellow and when it crosses the yellow. This will show and indicate the price possibly changing direction.
 The Stochastic RSI are the blue and red squiggly lines at the very bottom. These lines also move in the direction of the general price trend. If the lines are trending up and to the right, the price is also going up, and conversely if the lines are trending down and to the left, the price is also going down. The key to using this indicator is to watch as to whether or not the blue line is above or below the red and when it crosses over or under the red line. This will show and indicate the price possibly changing direction.
Both these indicators represent whether or not the commodity being traded is either overbought or oversold. Typically, when a commodity is overbought, the price is trending up and could reach the top of its channel. Conversely, when a commodity is oversold, the price is trending down and could reach the bottom of its channel. Most of the time, when these indicators are either at the top/overbought, or at the bottom/oversold, one can expect the price to change direction.
A Word About Using Indicators
Of course, if all these indicators were 100% accurate, everyone would use them and everyone would be rich. However, these indicators are used as tools and all of them are based on what is happening now or has happened in the past, which many often theorize that based on what has happened in the past can give some insight as to what is to happen in the future. There is some validity to this, but it is not 100% for sure as history doesn’t always tell us what is going to happen in the future when it comes to commodity trading!
Indicators such as these are to be used more as guidelines because price action and direction can change at the drop of a hat should something politically or globally happen as it may relate to oil and gas supply and demand. There are also common “chart patterns” that traders and investors study to gain further insight as to what might happen, and also many, many, many more indicators that traders like to look at and they all have different use cases. A lot tell the same story just in a different way, and you should use the indicators that you can easily understand. In addition, the concept of Diversified Oil and Gas investments and the ongoing Mineral Exploration across the US are crucial factors that influence market dynamics and investment strategies in this sector.
Now that you know how to read and interpret the charts, let’s get to the good stuff.
The Technical Perspective: Oil - West Texas Intermediate Crude (WTI)
WTI Price Chart on a weekly basis
At the end of July/early August in 2023, the price of WTI broke out above the first, shorter white trend line, which was a good sign. However, once it hit the secondary downward facing white trend line, it got rejected and the price stayed consistent with the trend. Since early November, the WTI futures price has dropped below $80/bbl and has also dropped below the 200-day moving average. As of late, the price of WTI has now been hovering around the mid to low $70’s/bbl. You can see on the far right that the price is currently around $74/bbl.
From a technical perspective, this shows there has been extended selling pressure and hinting at investment moving elsewhere and away from oil.
However, there may be some hope on the horizon in the coming weeks/months. We could witness three things happen:
1. The price of WTI could potentially go a bit higher, but stay in trend.
We can see from the chart above that since WTI’s high of $126 in March of 2022 the price of oil has been on the decline but the price is currently consolidating within the trend line triangle and has been testing a few major support zones. It has tested the bottom white trend line and the lower horizontal blue and gray lines approximately five times, which is showing strong support. The RSI appears to be approaching the midpoint – it is trending upwards, and the purple line is about to cross over the yellow line. The Stochastic RSI has also started trending upwards and has significant room to go higher before possibly correcting back to the downside.
2. A more bullish side of WTI with prices increasing due to buying pressure.
The price of WTI could increase further to the mid-upper $70/bbl to low $80’s range before correcting and moving back downward, possibly testing the support range of the mid-high $60/bbl range again. If this does happen and those lower prices are tested again and hold, we will definitely start seeing prices moving back to the upside. If prices also break the second long-term trend, we might see a more bullish side of WTI and we could test the blue horizontal line near the low $90/bbl range. If the price does breakout over the secondary downward facing trend line, we will look for a confirmation of the bullish move, meaning the price will most likely come down to test the downward facing trend line, bounce, then continue back up.
3. WTI price volatility
Lastly, given the way the price action is moving for WTI, one could assume that prices will continue to bounce up and down between the triangle of white trend lines. Time will tell and we’ll have to wait for a confirmed breakout before we can start seeing bullish optimism for WTI, which is not highly likely given the current US political climate.
What would cause a more bullish or positive outlook that could increase the price of WTI?
I believe it would take something significant, such as another large oil producer to enter into one of the current wars happening overseas. Generally speaking, history does tell us, in this case, that global conflict typically inflates the price of oil. Other than that, I would tend to believe that the price of oil will continue to be depressed and will stay below $80/bbl.
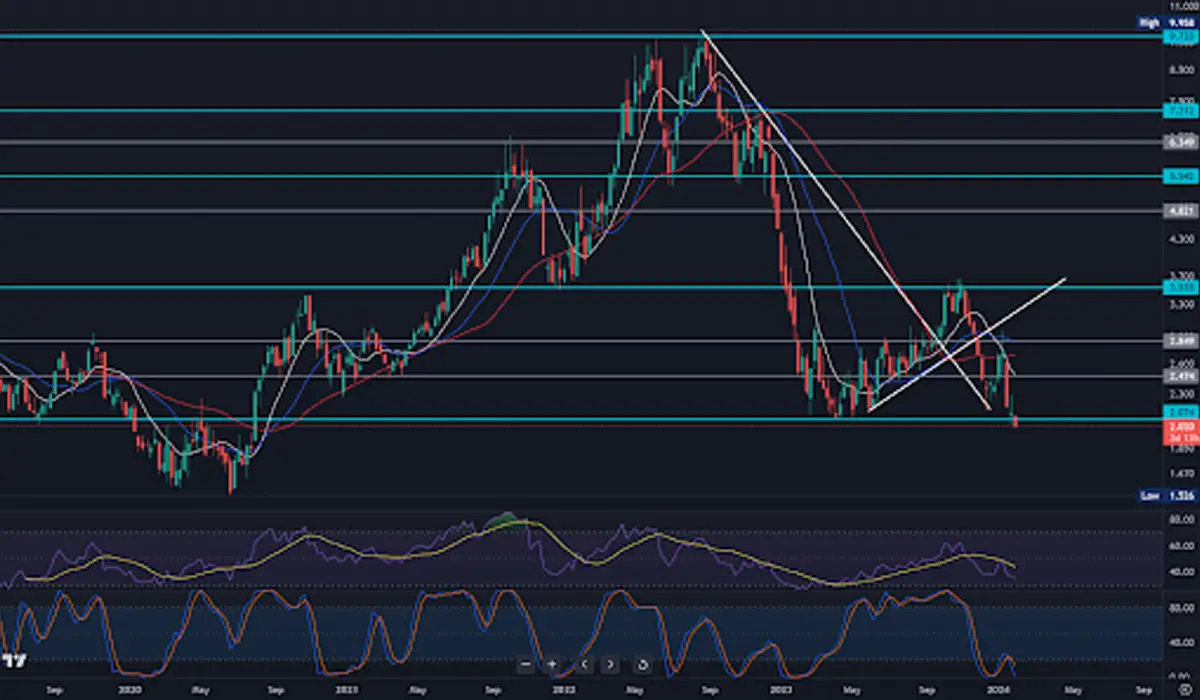
The Technical Perspective: US Natural Gas
We are a little more optimistic for Natural Gas, but we still need to approach investments into Nat Gas with cautious optimism. From the chart above, we can see it has already gone through a very substantial decline from its high of $9.95 in August 2022 and just in the last few weeks has broken down. You can see on the far right the price is currently around $2.00. Nat Gas tried to find support in the $2.07-$2.10 range, however, those levels have failed and it appears the price of Nat Gas could test the $1.75-1.90 range and go possibly as low as $1.60. Based on the additional technical indicators such as the RSI and Stoch RSI (the purple and yellow wavy lines), we do, in fact, have room to go lower. The Stochastic RSI (the blue and red lines) have started trending downwards again which gives credence to a more potential move to the downside. The reason I say I am a little more optimistic for Nat Gas is because, typically, after long or sharp periods of the price of something moving in a general direction, one would expect the price to eventually turn around.
The next 4-6 weeks will be very interesting to see how investors feel toward Natural Gas. Do we hold support in this area and try to make the push back up, or do we go lower?
Time will tell.
Fundamental Assessment
Now that we have a brief technical understanding of where oil and natural gas sit, let’s move on to the fundamental perspective to answer the question from the beginning:
“How are my mineral and royalty interests going to be affected?”.
The reason why I say, ”Generally, this is always a difficult question to answer since everyone’s situation is different.” I mean just that. Even though minerals and royalties are real estate, conceptually, owning minerals and royalties is not the same as owning other traditional commercial or residential real estate assets. Meaning you can’t just pull “comps” on properties similar to your own as no two or three properties are considered the same. Just because one person owns 50 Net Mineral Acres (NMA) in one section and someone else owns 50 NMA in the next section contiguous to yours, it does not mean those 50 NMA are created equal. There are numerous factors that can affect the value of one’s interests and we discuss those factors in other blogs.
The 5 Local, Global And Geopolitical Events Affecting Prices
1. Rig Counts and Drilling Permits Numbers are Low
Presently, US oil and gas rig counts and permits to drill across the continental US are on the decline, which is another reason we are witnessing declining oil and natural gas prices. Permits are down and operators are not drilling as many wells because prices are down and appear to be declining further. It’s very expensive for operators to set up drilling operations so there is less incentive to invest in drilling activities when their rate of return is economically risky. Operators will most likely want to keep the oil and gas in the ground, tailor back their operations and drill less wells, choke back their current producing wells, and wait for higher prices before producing more. There’s a saying in the industry, “Operators would rather sell one barrel of oil at $100 vs. two at $50.”
2. Consolidation of Existing Oil and Gas and Mineral and Royalty Companies
The only major investment in oil and gas and minerals and royalties are other larger oil and gas operators and mineral and royalty companies buying smaller outfits and/or merging with one another, which is basically just consolidation, nothing new or noteworthy. Then, those that get bought out are simply buying back in, buying another smaller mom and pop operator or mineral and royalty buyer, building it back up to another full fledged operating company or mineral and royalty company in order to be bought out again by another larger company.
Rinse and repeat is all that’s going on as opposed to having larger budgets to go out and explore for new areas of development or buy minerals and royalties in undefined or undeveloped areas. Additionally, understanding Oil and Gas Royalties in the US is crucial in this context of consolidation and investment.
3. Investments are Moving Towards Renewables
It is politics as usual and focus and investment is currently running, not walking, away from oil and gas and being hurled at renewable and ESG (Environment, Social, and Governance) projects. There is simply not a lot of “new money” coming into the oil and gas sector. This has been a major headwind for quite some time now and we don’t expect this to change anytime soon. I believe this is one of the major reasons we see the prices of oil and natural gas on the decline.
There is not a lot of perceived demand for either even though there is no other energy source currently to this day that can compete with the reliability of these precious commodities.
4. Instability in the Middle East and Eastern Europe
There are two wars going on in the world, one between Russia and Ukraine, and the other between Israel and Gaza. It now also looks like Iran and Pakistan have entered the fold. In the past, a war taking place anywhere in the world would substantially inflate the prices of oil and gas. Today, this seems to not be the case.
At the onset of each of the aforementioned wars, there was a tiny increase in the price of oil, but the overall trend since then is that both the prices of oil and nat gas have been on the decline. If the conflicts in Iran and Pakistan persist or expand to other territories, I believe we could see the price of both oil and natural gas spike since Iran is a substantial oil producer, but again, time will tell.
Another big-ticket item that is definitely going to have an effect on not just the price of oil and gas, but also the U.S. dollar and the U.S. economy is BRICS.
BRICS is an intergovernmental organization comprising Brazil, Russia, India, China, South Africa, and in the last several months Egypt, Ethiopia, Iran, Saudi Arabia, and the United Arab Emirates. The main point to BRICS is to develop another dominant world currency and eventually to de-throne the U.S. dollar from being the dominant currency. It is a means to establish deeper ties between member nations and cooperate on economic expansion, including trade. In the short term, this is a very long shot and the U.S. dollar will not be replaced that easily. Just like the dollar is backed by oil, which the U.S. has a tremendous amount of, the BRICS currency will also have to be backed by a sought after commodity, which will supposedly be gold. (It’s also worth pointing out that BRICS participants are also major oil producing countries.)
This is all still a long way off, but is certainly something to keep in mind over the next 5-10 years as more countries join in. If gold starts gaining more ground and the price starts to rise more quickly, this possibility becomes more realistic.
There are certainly more factors at play, but these are the big-ticket items in my opinion and until there is political change, we believe we’re going to continue to see investment leave the oil and gas space, thereby directly affecting mineral and royalty investment as well.
How Will This Affect Mineral My Mineral And Royalty Interests?
To get a rounded view, we need to look at the possible effects from both sides – the mineral and royalty owners and buyers.
The Mineral And Royalty Buyer Viewpoint
From the perspective of a mineral and royalty buyer, this is great news as it will be an opportunity to try and buy natural gas producing assets at a much lower rate. However, I would not be surprised if we see less buyers wanting to buy natural gas assets until we have a confirmed increase in prices and demand for natural gas.
I also believe mineral and royalty buyers will still be inclined to focus their capital on buying oil bearing interests. Therefore, if you have a substantial amount of cash sitting on the sidelines looking for investment, I would say now could be a very good time to start looking into buying both oil and natural gas bearing mineral and royalty interests while prices remain depressed or continue to decline. Once prices do turn around, which I definitely believe they eventually will, buying now will bring a great return on investment in the future once production increases.
The Mineral And Royalty Owner Viewpoint
As for the mineral and royalty owner, to answer this question in a general sense it depends on your situation and what’s going on in the area where your interests are located. It also depends on whether or not your mineral and royalty interests are oil bearing or natural gas assets due to everything mentioned herein. Oil assets are a bit safer, more reliable, and less susceptible to lower prices given all the wars currently going on in the US.
It also depends on whether or not you are heavily dependent on your royalty income as a main source of revenue to cover your living expenses. I believe there will be rough waters ahead for those mineral and royalty owners that rely heavily on their royalty revenue as their main source of revenue to cover normal living expenses. I am also inclined to say that if you’re an owner of a natural gas bearing mineral and royalty interest, you will certainly see more decline in your royalty revenue unless your operator decides or is forced to return and drill any new wells. But, again, the current price of gas will not yield as good of a royalty revenue.
If you are relying heavily on your royalty revenue to cover your living expenses, my advice is to trim your budget and tighten your belt because we could be going lower which would mean the same for your royalty revenues.
Selling Your Mineral Rights
It might not be a bad idea to consider selling your minerals in order to take advantage of a capital gain taxation versus being taxed at ordinary levels that your monthly royalty revenue is currently being taxed at. You can decide if you want to sell all of them or just a portion, you have options!
Remember that minerals and royalties, whether purchased or inherited, should ALWAYS be viewed and treated as an investment/asset and not as a family heirloom. I parrot this to my clients, ALWAYS!
If you need more information about selling your interests, check out the following articles:
Seeking advice from Land Management Consultant can also be beneficial in making informed decisions about your mineral rights and royalty options.
Thank you for taking the time to read this 2024 special report. Please send us an email or schedule a consultation to discuss your needs right away.
Kyle D. Venema
Founder, Venergy Momentum Oil & Gas

![Mineral and Royalty topic graph: [Natural gas price chart on a weekly time frame]](https://venergymomentum.com/wp-content/uploads/2024/02/wti-price-chart.webp)
![[WTI price chart on a weekly time frame] [Natural gas price chart on a weekly time frame]](https://venergymomentum.com/wp-content/uploads/2024/02/price-wti-natural-gas.webp)
![[WTI price chart on a weekly time frame]](https://venergymomentum.com/wp-content/uploads/2024/02/wti-price-chart-frame.webp)


Leave a Comment